The Background
When ModusFocus was a smaller application when it started off, a log line could often answer a question such as: “Why did this request fail?” As the application grew into multiple services, that became harder. One user action could begin in task-api, call a database, ask messaging-service to publish a queue message, and finish later in a background worker.
The important question changed from “What did this service do?” to:
What happened to this one user action from beginning to end?
This is why we added distributed tracing and structured, correlated logging. They help developers and support teams follow one story across services without guessing which unrelated log lines belong together.
Understanding Terminology
| Term | Simple meaning | Everyday comparison |
|---|---|---|
| Trace | The complete story of one action across the system | A parcel’s entire delivery journey |
| Span | One timed step inside that story | One stop on the delivery journey |
| Trace ID | The ID shared by all steps in one trace | The parcel tracking number |
| Span ID | The ID of one individual step | The ID of one delivery scan |
| Context | The small amount of information the next step needs to continue the story | The label passed from one delivery depot to the next |
traceparent | The standard value used to pass tracing context | The machine-readable part of the parcel label |
| Baggage | Small extra context that can travel with the trace | A small “handle with care” note on the parcel |
| Request ID | An ID for one incoming HTTP request | A support reference number |
| MDC | Temporary log context automatically added to log lines while work is running | A sticky note attached to every log line for this request |
What is distributed tracing?
Distributed tracing follows a request as it moves between different services.
Each request receives a trace identifier. Every operation performed as part of that request creates a span. These spans are connected to form a complete timeline of what happened.
For example, creating a task may follow this path:
React application
    ↓
Task Management API
    ↓
Authentication and permission checks
    ↓
MongoDB
    ↓
Response returned to the user
Without tracing, each step may write a separate log in a separate service. Finding the full story means searching manually and hoping the timestamps line up.
With tracing, each step becomes part of the same trace. In Grafana, we can see the order of work, how long each part took, and where a failure occurred.
The Guide
A shared request starting point
Every inbound HTTP request passes through ObservabilityServerFilter in task-common.
- Reuses a valid
X-Request-Idheader or creates a new one. - Adds safe context to MDC, including request, journey, workspace, and project identifiers.
- Adds the same safe context to the active OpenTelemetry span.
- Keeps that context available when Micronaut/reactive execution switches threads.
- Writes one completion log when the request finishes.
- Clears the temporary context, so it cannot leak into another request.
This means a normal completion log contains the route, status, duration, request ID, trace ID, and span ID. It is our “request finished” record.
HTTP request completed
method=PUT
route=/tasks/{taskId}
status=200
durationMs=84
requestId=...
traceId=...
spanId=...
Spans for meaningful work
The HTTP request is the top-level server span. We add child spans for work that matters when diagnosing performance or failures, including:
- MongoDB commands;
- JDBC/database calls;
- Google token verification;
- document and whiteboard Object Storage operations;
- messaging HTTP calls;
- OCI Queue publishing and consuming;
- important application operations such as task, document, and membership flows.
We deliberately do not create a span for every method. A trace should explain the journey, not become noise. A good span represents a meaningful operation, dependency call, or boundary.
A bridge across asynchronous queues
An HTTP call naturally passes context to the next HTTP service. A queue is different: its consumer can run much later, on another thread or machine.
For queue messages, QueueTraceContextService writes traceparent and tracestate into the message before publishing it. It also carries safe correlation details such as request ID, journey ID, workspace ID, and hashed actor ID.
When the queue worker receives the message, it extracts that context before creating the consumer span. The later worker activity can therefore remain connected to the original user action.
task-api request
  └─ messaging-service HTTP call
      └─ queue.tasks.publish                 PRODUCER span
          └─ queue.task-event.process        CONSUMER span
              └─ task event processing
This is the most important distributed-tracing lesson from our work:
If work is handed to a queue, the trace context must travel in the message. Otherwise the background worker begins a new, disconnected story.
Clear ownership when something fails
The tracing filter owns request-wide observation. The central AppExceptionHandler owns the final API failure record.
When a request fails, the handler resolves the safe error code, records failure metrics, marks the active span as failed, and writes one terminal error log. The response contains an errorId, so a user-reported error can be matched to protected internal diagnostics.
This gives us two useful views of the same failure:
- the client receives a safe, simple message and error ID;
- developers and support teams see the error code, cause type, dependency, trace, and request context.
How to read a trace in Grafana
Start with the top server span. It represents the incoming HTTP request.
Then ask three questions:
- What took the time? Look for the longest child span.
- Where did it fail? Look for a span with error status or error code.
- Did context cross service boundaries? Check that child spans in another service or a queue consumer share the same trace ID.
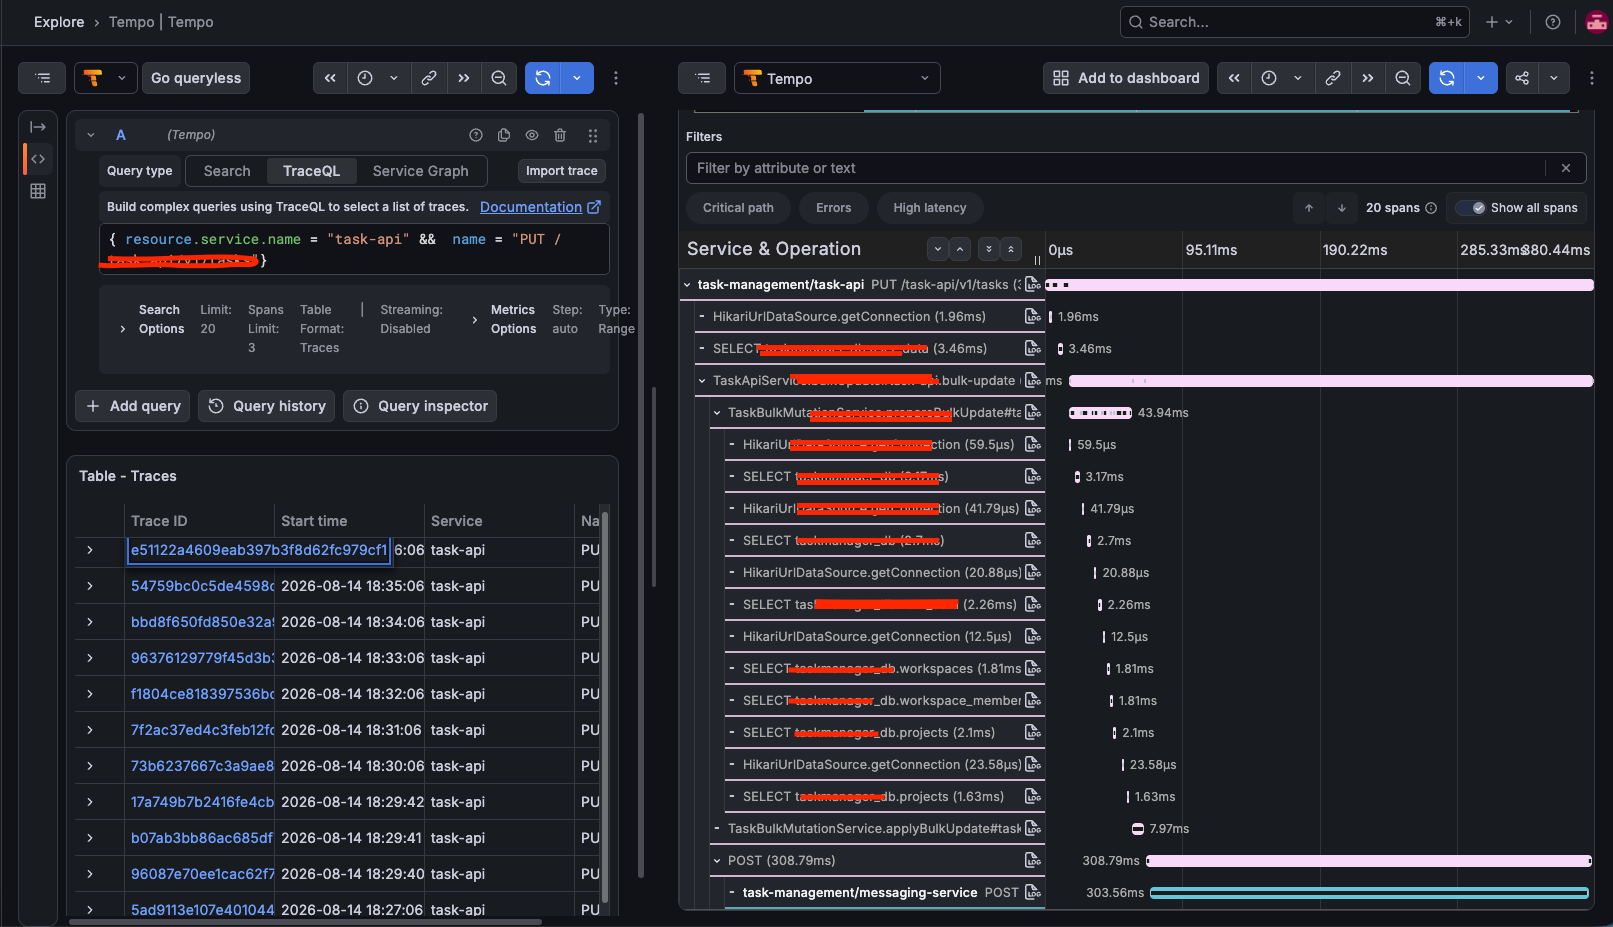
Scenario 1: Below snapshot shows how does trace looks like and send the trace to async api calls. The top http server span is for API call made by source UI/CLI etc, further down it shows database connection, sql queries, time taken by DB at various stages and then at the bottom async api call that publishes the metadata into OCI queue.
Scenario 2: Where the time spent
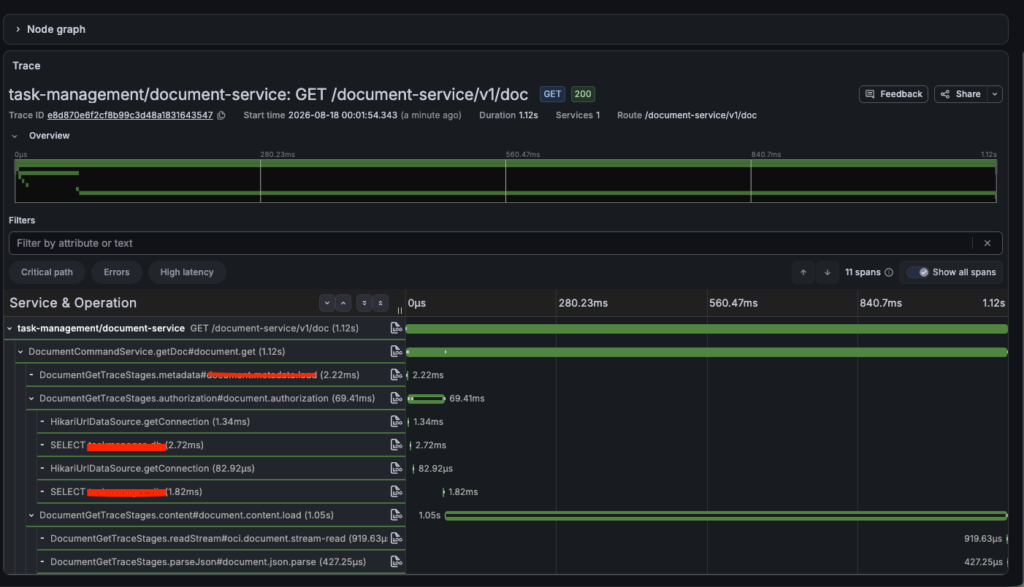
This trace answers a much better question than “Was the API slow?” It shows where the time went.
The whole request took 1.12 seconds. The metadata lookup took about 2 ms, and the authorization checks took about 69 ms. The document content-loading stage took about 1.05 seconds—almost the entire request.
When we open that stage in the detailed trace, we can see that the waiting time is in the OCI Object Storage call used to fetch the document content. Reading the returned stream and parsing the JSON take less than a millisecond, so they are not the cause of the visible delay.
This does not mean Document Service is doing unnecessary work for 1.12 seconds. It means the service is mostly waiting for the external storage dependency to return the document. The duration can change with network latency, the distance between the application and OCI region, normal provider variability, and the size of the document being retrieved.
The story this trace tells is simple:
The document API took 1.12 seconds, but the application code was not the main source of the delay. Almost all of the time was spent loading the document content from OCI Object Storage.
This is why detailed traces matter. They replace a vague conclusion—“the API is slow”—with a useful one: “the storage fetch is the part to investigate or optimise.”
Scenario 3: The API timed out because it could not obtain a database connection
This trace is useful because the outward symptom was simple: the profile API returned 503 Service Unavailable after roughly six seconds.
GET /task-api/v1/user/profile
HTTP 503
Total duration: 6.01 seconds
Without tracing, it would be tempting to conclude that the endpoint itself was slow or that a database query had timed out. The trace shows something more specific.
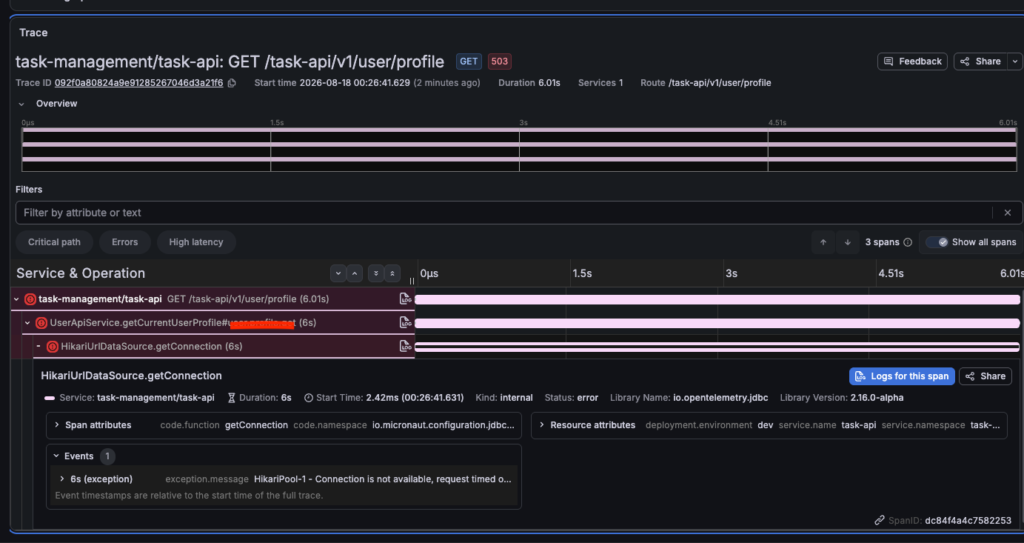
The request spent almost its entire lifetime inside:
HikariUrlDataSource.getConnection() — 6.0sThe recorded exception was:
HikariPool-1 - Connection is not available, request timed outIn other words, the application did not spend six seconds executing a slow SQL query. It waited for HikariCP, the application’s database connection pool, to hand it a connection. No connection became available within the configured six-second timeout, so the request failed with 503.
The trace narrows the investigation immediately. Instead of starting with endpoint code, I would next check Hikari pool metrics—active, idle and pending connections—alongside MySQL connection count, slow-query logs and database/network health.
Final Thoughts
Distributed tracing and logging are not mainly about collecting more data. They are about making a system understandable, easy to maintain, quicker to troubleshoot bugs and defects and most importantly showing the right information with proper co-relations. That turns debugging from “search everywhere” into “follow the journey.”